Absolute vs Relative Risk Calculator
Enter the number of people who experienced the event (e.g., stroke, side effect) in each group.
Absolute Risk Reduction
Relative Risk Reduction
Number Needed to Treat (NNT)
People need to take the drug for one person to benefit.
Interpretation
Enter data to see how marketing numbers compare to real-world impact.
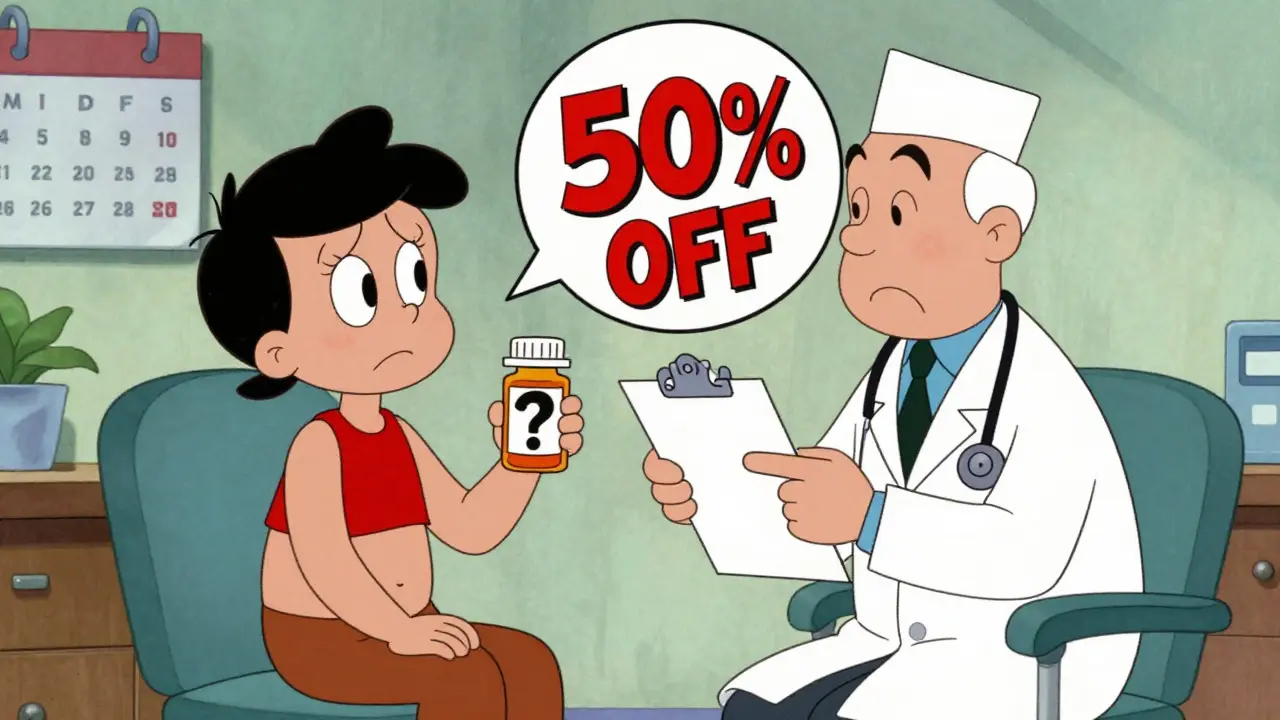
Imagine a doctor tells you a new medication cuts your risk of a serious condition in half. That sounds amazing, right? You might immediately picture yourself as one of the lucky ones who avoids the problem entirely. But here is the catch: if your original risk was only 0.1%, cutting it in half means your new risk is 0.05%. The benefit is real, but is it worth the potential side effects or the cost? This is where understanding the difference between absolute risk and relative risk becomes critical for making smart health decisions.
We see these numbers everywhere-in pharmaceutical ads, news headlines, and during consultations with our doctors. Yet, most of us interpret them through the same lens, often leading to confusion or unnecessary worry. When you know how to read these statistics, you stop being a passive recipient of information and start having informed conversations about your care. Let’s break down exactly what these terms mean, why they matter, and how to use them to protect your health.
What Is Absolute Risk?
Absolute risk is the straightforward probability that something will happen to you within a specific timeframe. It answers the question: "What are my actual odds?" If a study says that 1 out of 100 people taking a certain drug experiences nausea, the absolute risk of nausea is 1%.
This metric gives you context. It tells you how common or rare an outcome really is. Without absolute risk, numbers can feel abstract and scary. Knowing that your baseline risk of a heart attack is 2% helps you weigh whether a treatment that lowers it to 1% is worth pursuing. It grounds the data in reality.
What Is Relative Risk?
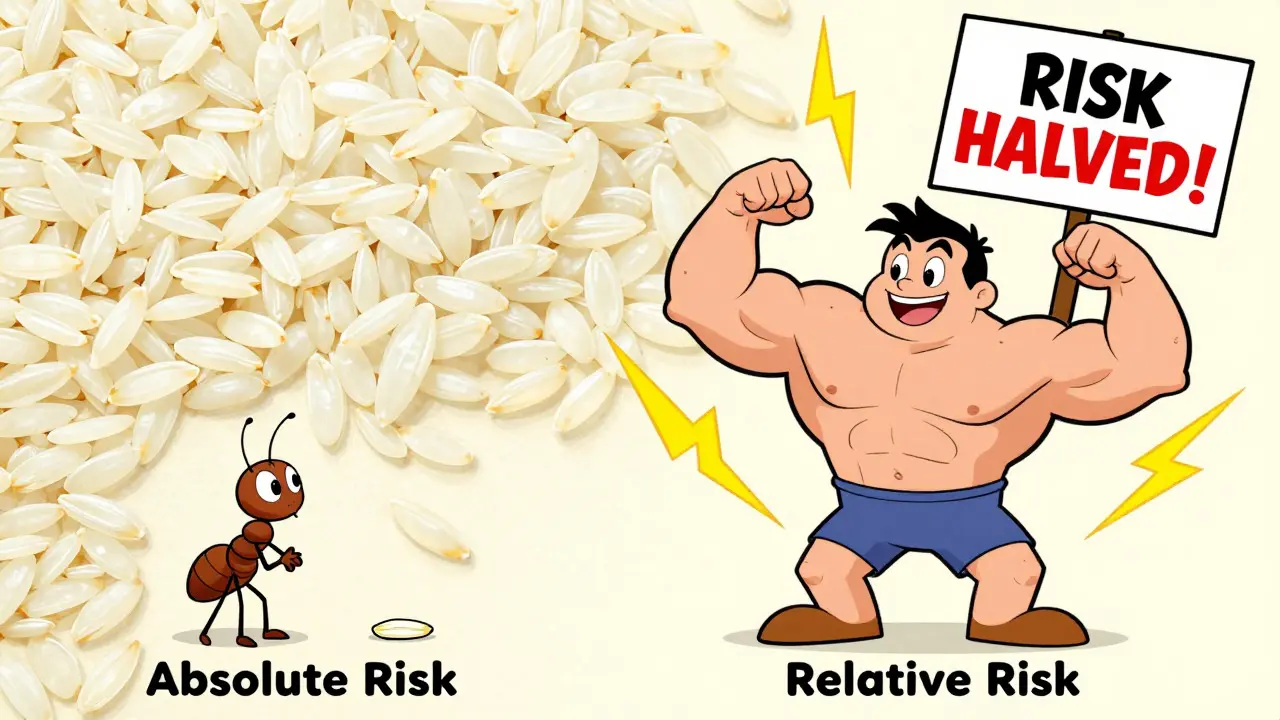
Relative risk compares the likelihood of an event happening in one group versus another. Usually, this means comparing people taking a drug to those taking a placebo or no treatment at all. It answers the question: "How much more or less likely am I to experience this compared to someone else?"
For instance, if Group A has a 10% chance of getting sick and Group B has a 5% chance, the relative risk for Group A compared to Group B is 2.0 (10% divided by 5%). This means Group A is twice as likely to get sick. While useful for identifying associations, relative risk doesn't tell you how big the actual problem is. A doubling of risk from 1 in a million to 2 in a million is still extremely rare, even though the relative risk is 2.0.
The Math Behind the Marketing
Why do drug commercials love relative risk? Because it often looks bigger. Let’s look at a concrete example involving a hypothetical blood thinner called "ThromboGuard."
- Placebo Group: 2 out of 1,000 patients had a stroke (0.2% absolute risk).
- Drug Group: 1 out of 1,000 patients had a stroke (0.1% absolute risk).
If you calculate the Relative Risk Reduction (RRR), you divide the reduction (0.1%) by the original risk (0.2%). The result is 50%. The ad can proudly claim, "ThromboGuard reduces stroke risk by 50%!"
However, the Absolute Risk Reduction (ARR) is simply the difference between the two percentages: 0.2% minus 0.1% equals 0.1%. So, the drug actually reduces your individual risk by just one-tenth of a percent. Both statements are mathematically true, but they paint very different pictures. One suggests a massive benefit; the other suggests a modest one.
| Metric | Calculation | Result | Interpretation |
|---|---|---|---|
| Absolute Risk Reduction (ARR) | 0.2% - 0.1% | 0.1% | Your personal risk drops by 0.1 percentage points. |
| Relative Risk Reduction (RRR) | (0.2% - 0.1%) / 0.2% | 50% | The risk is halved compared to not taking the drug. |
Understanding Number Needed to Treat (NNT)
To bridge the gap between these two metrics, experts use the Number Needed to Treat (NNT). This is perhaps the most practical statistic for patients because it translates probabilities into human terms. NNT tells you how many people need to take the drug for one person to benefit.
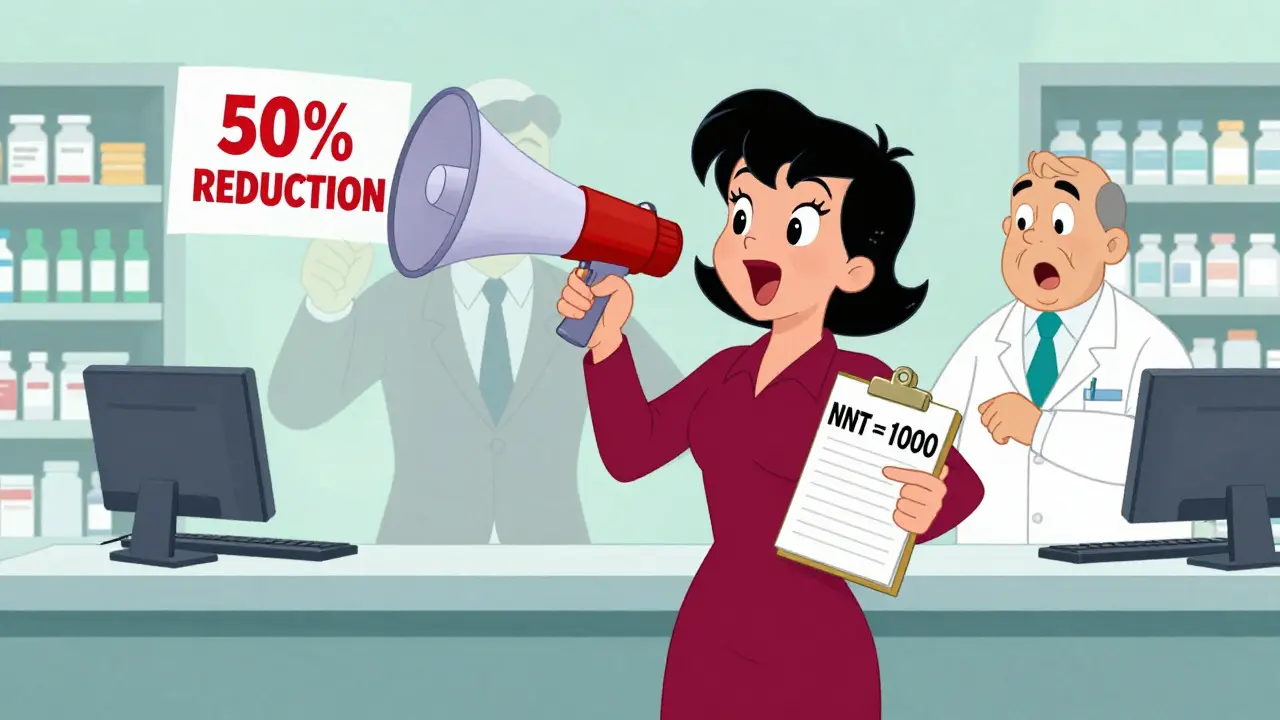
You calculate NNT by dividing 1 by the Absolute Risk Reduction (expressed as a decimal). In our ThromboGuard example, the ARR is 0.001 (0.1%). So, 1 divided by 0.001 equals 1,000. This means you would need to treat 1,000 people with ThromboGuard to prevent just one stroke. Is that worthwhile? Maybe, if the drug is cheap and has no side effects. But if it causes severe bleeding in 1 out of every 50 patients, the math gets complicated quickly.
A low NNT (like 2 or 3) indicates a highly effective treatment. A high NNT (like 100 or more) suggests the benefit is small for the average person. Always ask your doctor for the NNT when discussing preventive medications.
Why Pharmaceutical Ads Use Relative Risk
It is not necessarily malicious, but it is strategic. The global pharmaceutical market is valued at over $1.5 trillion. Companies have a strong incentive to highlight benefits. Studies show that direct-to-consumer ads frequently emphasize relative risk reductions because the numbers appear more impressive. A "50% reduction" grabs attention far better than a "0.1% reduction," even though they describe the same clinical outcome.
This practice has led to what some experts call "statistical deception." By omitting the baseline absolute risk, advertisers leave consumers without the context needed to make an informed choice. Regulatory bodies like the FDA and EMA have started cracking down on this, requiring clearer disclosures, but the habit persists in marketing materials and even some media reports.
How to Interpret Side Effects Correctly
Side effects are reported using the same statistical principles. If a drug label says it increases the risk of liver damage by 200%, that sounds terrifying. But let’s look closer.
- Baseline Risk: Liver damage occurs in 1 out of 10,000 people naturally.
- With Drug: Liver damage occurs in 3 out of 10,000 people.
The relative risk increased by 200% (from 1 to 3 cases). However, the absolute risk increase is only 0.02% (2 extra cases per 10,000). The Number Needed to Harm (NNH) would be 5,000. This means you’d need to treat 5,000 people for one additional person to suffer liver damage due to the drug. Understanding this distinction prevents panic over rare but statistically "doubled" risks.
Tips for Patients and Caregivers
When reviewing medical information or talking to your provider, keep these strategies in mind:
- Ask for the Baseline: Whenever you hear a percentage change, ask, "Compared to what?" Find out the starting risk.
- Request Absolute Numbers: Ask, "What is the absolute risk reduction?" or "What is the number needed to treat?"
- Check the Timeframe: Risks are always tied to a duration. A 10% risk over 10 years is very different from a 10% risk over 1 year.
- Look for Visuals: Pictograms showing 100 people are much easier to understand than raw percentages. If a brochure uses charts, pay close attention to the scale.
- Beware of Headlines: News articles often quote relative risk because it makes for a stronger headline. Dig deeper into the full article or study summary.
Conclusion
Knowing the difference between absolute and relative risk empowers you to cut through the noise of medical marketing. Relative risk tells you the strength of an association, while absolute risk tells you the practical impact on your life. Neither is wrong, but relying on only one leads to skewed perceptions. By asking for both-and ideally the NNT-you ensure that your healthcare decisions are based on clear, contextualized facts rather than impressive-sounding but misleading statistics.
What is the main difference between absolute risk and relative risk?
Absolute risk is the actual probability of an event happening to you (e.g., 1 in 100), while relative risk compares your risk to another group's risk (e.g., twice as likely as someone else). Absolute risk provides context about how common an event is, whereas relative risk highlights the magnitude of change between groups.
Why do drug advertisements focus on relative risk?
Relative risk reductions often produce larger, more impressive-sounding numbers than absolute risk reductions. For example, reducing a risk from 2% to 1% is a 50% relative reduction but only a 1% absolute reduction. Advertisers use relative risk to make benefits appear more significant.
What does Number Needed to Treat (NNT) mean?
NNT is the number of patients who need to take a medication for one patient to benefit. It is calculated by dividing 1 by the absolute risk reduction. A lower NNT indicates a more effective treatment. For instance, an NNT of 10 means 10 people must be treated for 1 to avoid the negative outcome.
Is relative risk ever misleading?
Yes, relative risk can be misleading if presented without the baseline absolute risk. A large relative increase in a very rare event may still result in a negligible absolute risk. Conversely, a small relative decrease in a very common event can represent a significant absolute benefit. Context is key.
How can I tell if a medical statistic is trustworthy?
Look for sources that provide both absolute and relative risks, specify the timeframe, and mention the sample size. Trusted sources include peer-reviewed journals, government health agencies (like the CDC or FDA), and reputable medical organizations. Be skeptical of headlines that only cite dramatic percentage changes without explaining the baseline risk.
Sinead Doyle
statisticians are just the gatekeepers of the big pharma industrial complex, trying to confuse you with their jargon so you dont realize theyre selling you poison wrapped in a placebo effect. absolute risk is a lie because your baseline risk is manipulated by the environment they control. they want you to think its math but its actually psychological warfare designed to keep you dependent on their chemical shackles. wake up sheeple before the next vaccine mandates roll around and they use these 'relative' numbers to justify injecting more toxins into your veins.
Emily Schor
This is such a helpful breakdown. I always get confused when doctors talk about percentages without giving context. It makes sense that knowing the actual number helps make better decisions. Thanks for explaining it clearly.
Arun Krishnan
Great post. Simple explanation helps everyone understand. Keep asking questions to your doctor. You got this.
Bobby Christiansen
Oh please, stop acting like we are all stupid :(. Doctors know what they are doing and if they say take it, you take it. This whole article is just fear-mongering to make people distrust medicine. We need to trust our leaders and not read conspiracy theories online. It is so annoying when people try to play doctor instead of listening to experts who spent years studying this stuff. Grow up already.
anna arifiana
I have to say; however, this entire premise is somewhat flawed in its execution, don't you think? The way you present the data feels slightly biased towards skepticism, which, while understandable, might lead some readers to dismiss valid medical advice altogether. Furthermore, the examples chosen seem rather extreme, and thus, perhaps not representative of the average patient's experience. One must consider, therefore, the broader implications of such messaging on public health compliance, especially during times of crisis. It is a delicate balance, indeed.
Marie-Gladys Darcelin
It is truly disheartening to see how little critical thinking exists in modern society. Most people would blindly follow any statistic presented to them without questioning the methodology or the source. This lack of intellectual rigor is precisely why we are where we are today. If one cannot grasp the difference between absolute and relative risk, one should perhaps refrain from making independent healthcare decisions altogether. Education is clearly lacking.
Angie Lara
In my country we often see similar issues with how stats are reported in local news. Its really important to ask for the full picture. I found this very useful info thanks for sharing. Hope it helps others too.
Patrick Meyer
lol wow, basic statistics explained for the masses. i suppose most of you cant even do long division so this is groundbreaking. the nnt concept is elementary for anyone with a science degree but apparently heres a gold star for figuring out that 50% off doesnt mean much if the original price was pennies. enlightening stuff.
Prashant Shishodia
You need to be smart about your health. Ask the right questions. Do not let them fool you. Be strong and informed. Good luck.
Autumn LW
This is exactly why the general population is so uninformed. They read a headline and think they are experts. Real understanding requires deep study, not a quick blog post summary. Stop spreading half-truths and go read the actual clinical trials if you want to be taken seriously. Your ignorance is showing.
Scott Colter
It seems we are dancing around the edges of truth here. What is real anyway? Is the risk absolute or is it just a construct of our perception? Perhaps the numbers are just shadows on the cave wall, and the true benefit lies in the journey of understanding itself. A fascinating philosophical puzzle wrapped in a statistical skin.
Paul Lyons
Foreign studies mean nothing to us here. Our bodies are different. Our water is different. Why listen to global stats when our own government has its own agenda? This is typical elite manipulation to confuse the patriots. Stick to what works for us and ignore the international nonsense. America first in health care!